Hello Everyone...
Recently many people started asking me to write a post on Using a Prompt as a report selector in OBIEE11g. We all know it is not a new requirement, It is most common requirement in many of the project. This is a bit tricky in 10g version but in 11g this is a simple task. In 10g version we are using "Guided Navigation Link" to get this done. In 11g version we can do it very simply using the "Section --> Condition" option in the dashboard. In this post we will see how to do it....
Scenario: We have three reports, for example 1) Yearly Revenue Report 2) Quarterly Revenue Report
3) Monthly Revenue Report
The reports should be displayed on the dashboard as per the user selection i.e there should be a prompt which displays the three reports names depending on the report name that the user selected in the prompt the respective has to display. If the user selects Year value in the prompt then only year report has to display, If the user selects Quarter then Quarter report has to display and so on...
Here the user can have two choices either he can able to see only one report at a time using Radio button prompt or he can able to see multiple reports at a time using choices list prompt. In this post we will see the second option (Selecting multiple reports or Single report at a time). This is easy in 11g because of the Presentation Variable property, like i discussed in my earlier post the Presentation variable in 11g can capture multiple values. Please follow the below steps to do get this requirement....
Step 1: Creating the Reports
I am going to create three reports now Yearly Sales, Quarterly Sales and Monthly Sales as follows


Step 2: Creating the Dashboard Prompt
Create a new dashboard prompt by clicking on 'New" and then by selecting "Dashboard Prompt" as shown in the below screenshot

Now select the Subject Area from which you want to create the prompt. In my case i have used "Sample Sales Lite"

Click on the Add (+) icon and select Column Prompt

Now select any column from any of the tables because we not going to use any column values here we will create one dummy column and Hard code the report names as values.

I have selected the Per Name Year column and renamed it to "Select the Report" as shown in the below screenshots. Select the User Input as "Choice List" (By default it would be Choice List only)


Click on the Edit formula icon of the prompt and in the column formula.

Just enter any string value in the single quotes and click on Ok. In my case it is 'Dummy'

Now expand the Options ans select the "Choices List Values" as Specific Column Values as shown in the below screenshot.


Now Click on Edit icon and enter your report names as values of the prompt as per the requirement.

In my case i have given the report names as Year, Quarter and Month in the prompt. Here the report names are nothing but values of a column.

After entering the values click on Ok

Depending on your requirements select the options "Enable user to select multiple values", "Enable user to type values" and "Require user input".
Here very important thing is defining a "Presentation Variable" . In Select a Variable section select "Presentation Variable" then give one name in the below box. In my case i have created a variable called "Select" . All the presentation variable names are case sensitive so we need to be careful while creating a filter with presentation variable. You can see i have used the same name of the variable everywhere (Select) with the same case how ever i created it.
Enable user to select multiple values : If you need to enable multi values select option for the user you must select this option. In my case i would like to give the option to the end user to select multiple values so i enabled it by clicking on the check box.
Enable user to type values: Some times the user would like to type in the values like a text box field so this check box enables that feature so that the user can directly type the values with out selecting it from the prompt drop down.
Require user input: If you would like to make this prompt as a mandatory selection the you can select this check box. This option will disable the "Apply" button if the user is not selecting any value from the prompt.

After selecting all the required options save the prompt by clicking on Save icon as shown in the below screenshot.

Step 3: Creating the dummy reports for section condition validation.
Now create 3 dummy reports one for Yearly report , one for quarterly report and one for monthly report as shown in the below screenshots.
We have pull any column from any table to the criteria tab and go to Edit Formula and just give the Report name what ever you have given in the Prompt. The Report name that we have given in the Prompt and the value we are giving in this dummy column should be the same.

Remove the existing name give the new name as per the prompt value

In my case i have given "Year" as a value in the prompt and the same i have given in the edit formula in the single quote as it is a string.

Now click on the filter of the column properties.


Type the presentation variable name that we have created. In my case it is "Select" (Case sensitive) and click on Ok.

After doing this you can see the filter as follows. Then save the report. In my case i have saved this report as Year Dummy.

Repeat the same process for creating Quarter Dummy report and Month dummy report as shown in the following screenshots.


By the end of this step you will have three dummy reports created Year , Quarter and Moth.
Step 4: Creating a New Dashboard to Place these reports.
Click on the New icon and select the "Dashboard" option.
 Give the dashboard name. Here i have given the dashboard name as Report Selector. You can see the same on the following screenshots

Now add the content to the dashboard as shown below

Add four sections one is for Prompt , one is for Year report, one is for quarter report and one is for month report.

Now drag and drop the prompt and reports in the respected sections. Better to follow the order either ascending or descending because if you dont follow the order then the reports will display in jumbling manner when the user is selecting all the values in the prompts. I followed the descending order here so if we select all the values in the prompt then first Year, next Quarter and last Month Report will come in the order.

Now click on the section properties of the Year report section and select "Condtion"

Now click on Filter icon.

select Analysis and click on Browse

select the Year Dummy report that we created in the previous step and click on Ok.

Click on Ok

Click on Ok

Repeat the same process for Quarter report section and Month Report Section


After adding the section conditions to the three report sections save the dashboard by clicking on the Save Icon and click on Run.

Now on the dashboard we can see only the prompt with three report names as check boxes as follows.

Now select the Year option and click on Apply ......

You can see only Year report on the dashboard

Now select the Quarter option and click on Apply ......

You can see only Quarter report on the dashboard

Now select the Month option and click on Apply ......

You can see only Month report on the dashboard

Now select all the three options and click on Apply ......

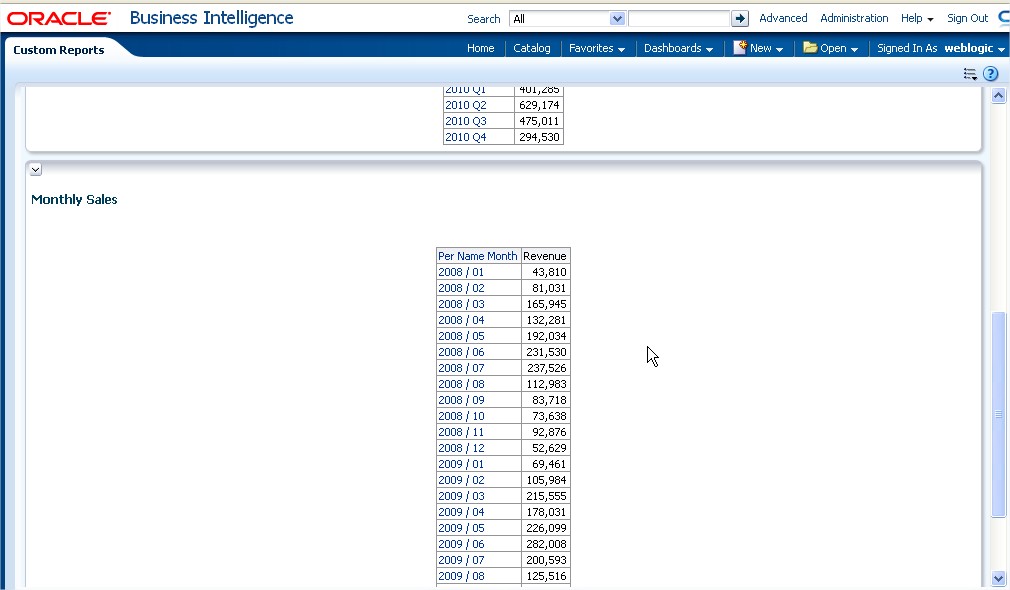
You can see all the three reports now ..... Year report, Quarter Report and Month Report on the dashboard in the same order how we kept the sections in the dashboards.

This is the continuation of the above screenshot.....

Step 1: Creating the Reports
I am going to create three reports now Yearly Sales, Quarterly Sales and Monthly Sales as follows


Step 2: Creating the Dashboard Prompt
Create a new dashboard prompt by clicking on 'New" and then by selecting "Dashboard Prompt" as shown in the below screenshot

Now select the Subject Area from which you want to create the prompt. In my case i have used "Sample Sales Lite"

Click on the Add (+) icon and select Column Prompt

Now select any column from any of the tables because we not going to use any column values here we will create one dummy column and Hard code the report names as values.

I have selected the Per Name Year column and renamed it to "Select the Report" as shown in the below screenshots. Select the User Input as "Choice List" (By default it would be Choice List only)


Click on the Edit formula icon of the prompt and in the column formula.
Just enter any string value in the single quotes and click on Ok. In my case it is 'Dummy'

Now expand the Options ans select the "Choices List Values" as Specific Column Values as shown in the below screenshot.


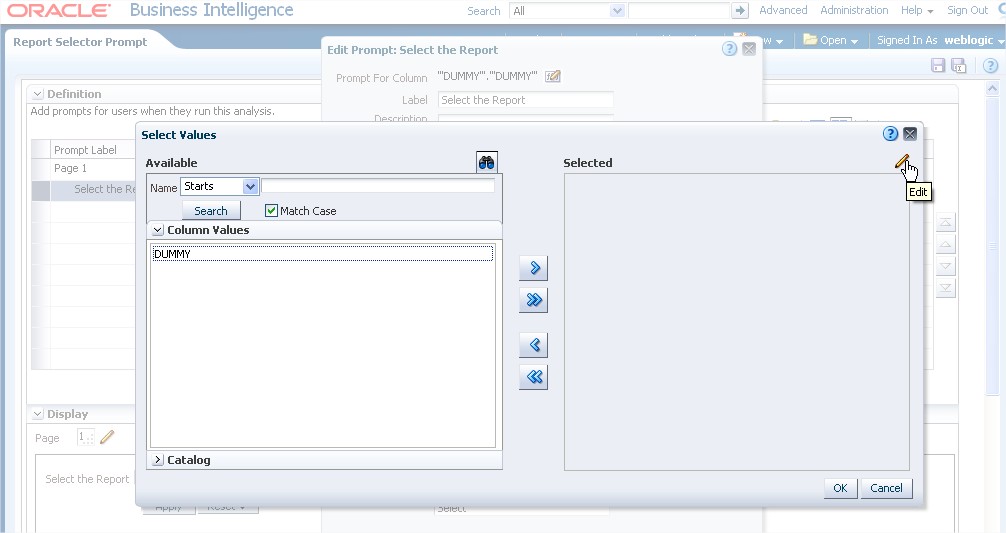
In my case i have given the report names as Year, Quarter and Month in the prompt. Here the report names are nothing but values of a column.

After entering the values click on Ok

Depending on your requirements select the options "Enable user to select multiple values", "Enable user to type values" and "Require user input".
Here very important thing is defining a "Presentation Variable" . In Select a Variable section select "Presentation Variable" then give one name in the below box. In my case i have created a variable called "Select" . All the presentation variable names are case sensitive so we need to be careful while creating a filter with presentation variable. You can see i have used the same name of the variable everywhere (Select) with the same case how ever i created it.
Enable user to select multiple values : If you need to enable multi values select option for the user you must select this option. In my case i would like to give the option to the end user to select multiple values so i enabled it by clicking on the check box.
Enable user to type values: Some times the user would like to type in the values like a text box field so this check box enables that feature so that the user can directly type the values with out selecting it from the prompt drop down.
Require user input: If you would like to make this prompt as a mandatory selection the you can select this check box. This option will disable the "Apply" button if the user is not selecting any value from the prompt.

After selecting all the required options save the prompt by clicking on Save icon as shown in the below screenshot.

Step 3: Creating the dummy reports for section condition validation.
Now create 3 dummy reports one for Yearly report , one for quarterly report and one for monthly report as shown in the below screenshots.
We have pull any column from any table to the criteria tab and go to Edit Formula and just give the Report name what ever you have given in the Prompt. The Report name that we have given in the Prompt and the value we are giving in this dummy column should be the same.

Remove the existing name give the new name as per the prompt value

In my case i have given "Year" as a value in the prompt and the same i have given in the edit formula in the single quote as it is a string.

Now click on the filter of the column properties.

Select the operator as "Is equal to / Is in" then click on "Add More Options" and select "Presentation Variable"

Type the presentation variable name that we have created. In my case it is "Select" (Case sensitive) and click on Ok.

After doing this you can see the filter as follows. Then save the report. In my case i have saved this report as Year Dummy.

Repeat the same process for creating Quarter Dummy report and Month dummy report as shown in the following screenshots.


By the end of this step you will have three dummy reports created Year , Quarter and Moth.
Step 4: Creating a New Dashboard to Place these reports.
Click on the New icon and select the "Dashboard" option.


Now add the content to the dashboard as shown below

Add four sections one is for Prompt , one is for Year report, one is for quarter report and one is for month report.

Now drag and drop the prompt and reports in the respected sections. Better to follow the order either ascending or descending because if you dont follow the order then the reports will display in jumbling manner when the user is selecting all the values in the prompts. I followed the descending order here so if we select all the values in the prompt then first Year, next Quarter and last Month Report will come in the order.

Now click on the section properties of the Year report section and select "Condtion"

Now click on Filter icon.

select Analysis and click on Browse

select the Year Dummy report that we created in the previous step and click on Ok.

Click on Ok

Click on Ok
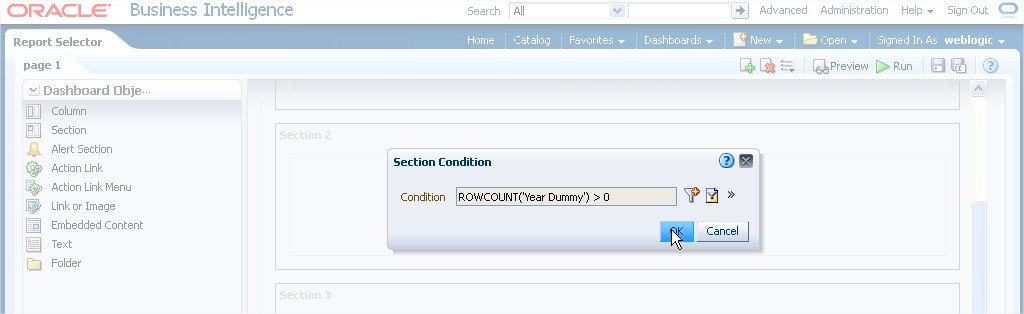
Repeat the same process for Quarter report section and Month Report Section


After adding the section conditions to the three report sections save the dashboard by clicking on the Save Icon and click on Run.

Now on the dashboard we can see only the prompt with three report names as check boxes as follows.
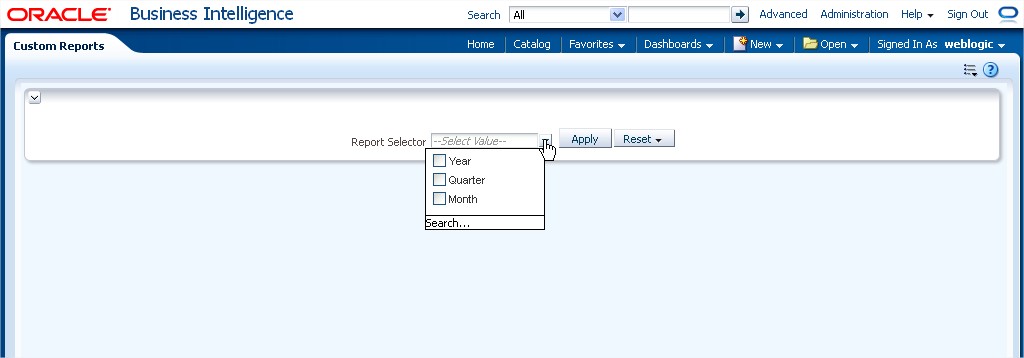
Now select the Year option and click on Apply ......

You can see only Year report on the dashboard

Now select the Quarter option and click on Apply ......

You can see only Quarter report on the dashboard

Now select the Month option and click on Apply ......

You can see only Month report on the dashboard

Now select all the three options and click on Apply ......

You can see all the three reports now ..... Year report, Quarter Report and Month Report on the dashboard in the same order how we kept the sections in the dashboards.

This is the continuation of the above screenshot.....
Hope this helps you.............
Thanks,
Nagarjuna